
5 Shakespearean words we should use more often
You might be surprised about how many everyday words and phrases come from Shakespeare. But what about the less common words?
3 December 2019 by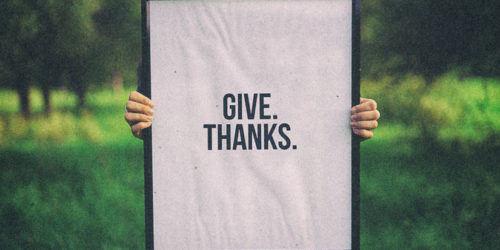
How to write a thank-you note
We might think we know how to give thanks. But, in this festive season, it’s important to brush up on our skills to show appreciation for the people in our lives. Here are some musts in a thank-you letter.
27 November 2019 by
How to explain the importance of readability to your team
You want to spread awareness about plain language and its clear benefits. How can you persuade your team that clarity is the way forward?
21 November 2019 by
5 grammar “rules” which aren’t real
Many well-known grammar rules stem from outdated advice. What are some of these unreasonable guidelines and why are they no longer necessary?
7 November 2019 by
Are you scaring the general public away with poor reach?
This spooky season, we’re loving scary stories, but not scary copy. How can you check yours with Readable’s new ‘Reach’ feature to ensure your audience doesn’t close the door on you?
30 October 2019 by
Examples of wordy sentences – and how to correct wordiness
What does it mean for a sentence to be 'too wordy'? How can you edit sentences to decrease wordiness and improve readability?
24 October 2019 by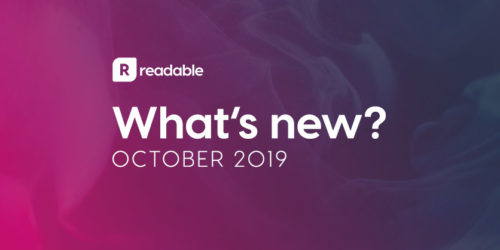
What’s new in October 2019? Introducing Reach
See what the Readable team has been up to in June 2019.
22 October 2019 by
How to write a persuasive job description
How can you write a job description that stands out, grabs the reader's attention and attracts the right candidate?
17 October 2019 by
How can we reduce workplace email despair?
Since email’s conception, there have been a host of other methods of communication developed - but email is still the most commonly used in the workplace. What are some common email faux pas, and how can we do better?
10 October 2019 by
Plain language at PLAIN 2019: Readable goes to Oslo
Readable headed to the most important plain language event of the year. What does PLAIN stand for and how did the conference remind us of our core values?
3 October 2019 by
What are Laura’s key SEO takeaways from BrightonSEO 2019?
This year was my first BrightonSEO - and, I hope, the first of many. It’s amazing that a conference that originated in a room above a pub in our hometown of Brighton has come such a long way and now welcomes SEOs from all over the world. Here are the key takeaways that have inspired Readable.
18 September 2019 by
UX and readability: a readable rebuttal
If you read a UX Matters blog post about readability, you might have some questions about its value in UX. We’re here to address them.
10 September 2019 by