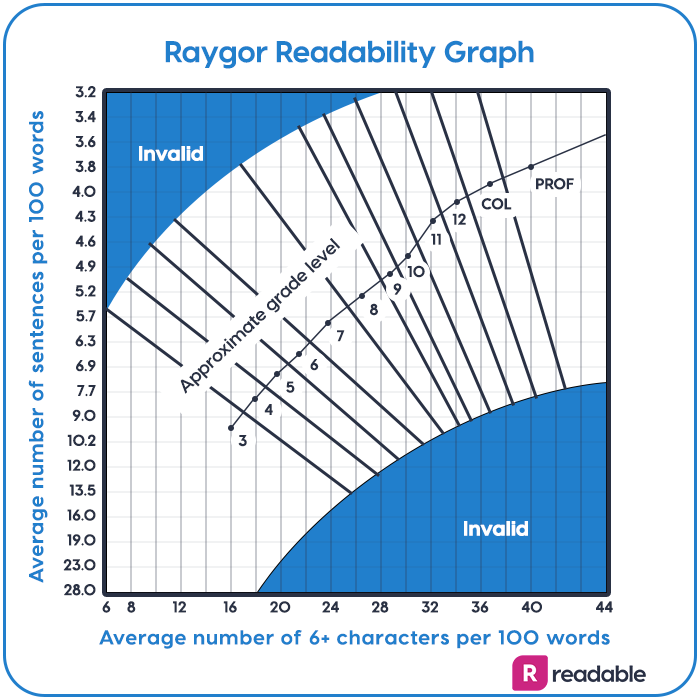
What is the Raygor estimate graph?
The Raygor estimate graph is a graph-based readability formula. It calculates the US grade level of a text. It promises a quick way to classify a piece of writing. The graph is simple and easy to understand.
How is the Raygor grade level calculated?
The formula was originally calculated as follows:
- Extract a 100-word excerpt from the selection. If the text is very long, take subsamples from the beginning, middle, and end of the text.
- Count the number of sentences in each passage. Count a half sentence as 0.5.
- Count the number of words in each passage containing six or more letters.
- Find the point on the Raygor estimate graph.

When using Raygor with Readable, you don't need to take a sample or plot-point on a graph. The tool will analyse your text as a whole. It will then convert it to a grade level instantly.
Where did the Raygor graph come from?
The Raygor graph was created by Alton L Raygor in 1977. Inspired by the Fry formula, he created Raygor as a similar calculation. However, it had a key difference. The Fry graph uses syllables as a variable. Raygor uses letter counting. In Raygor, words with six or more letters are counted as difficult.
Raygor felt that syllable counting was more time-consuming than letter counting. The Fry graph is widely respected and used. Nevertheless, Raygor is highly accurate.
Letter counting is thought to have better test-retest reliability. Most notably, with ARI - the Automated Readability Index. This is because syllables can be misinterpreted.
How can Raygor best be used?
The Raygor graph is best used for middle school education.
The Raygor formula can plot texts up to college level. However, the graph is best used in middle school education to classify texts. It’s not suitable for elementary level materials. This is because it cannot score a text below third grade. A middle school text is equal to a reading age between 11 and 14.
A reading grade level is useful for teachers, librarians, and parents in classifying the texts most appropriate for an individual.
Plain English means better retention and comprehension. It is more likely to encourage the student. Readability formulas such as the Raygor graph provide a useful objective view. This can then be used alongside subjective considerations. Such as the reader’s background, ability, and motivation.

